
📊 Full opportunity report: Bitcoin Battles Unfold in Live Warzone Visualization on ThorstenMeyerAI.com — validation score, market gap, and execution plan.
TL;DR
A new web-based project visualizes Bitcoin trading activity as a live warzone, depicting buy and sell orders as combatants in an ongoing battlefield. The visualization is accessible in real-time via browser technology, offering an artistic perspective on market volatility without trading functionality. The project highlights the potential for creative data visualization using advanced web tech.
Bitcoin trading activity is now being visualized as a live cinematic battlefield through a new browser-based project from isbitcoindead.com. The interactive visualization depicts the ongoing tug-of-war between buyers and sellers, turning market data into a visceral war scene. This development offers a novel, artistic perspective on market volatility, accessible instantly in any modern browser, and underscores the potential for creative data visualization in finance and tech communities.
The project, called Bitcoin War, connects directly to the public Binance trade stream via WebSocket, with an automatic fallback to Coinbase, ensuring continuous real-time data flow. Each market tick is rendered as a combatant—buy orders from the Cobalt Host advance from the left, while sell orders from the Ember Legion push back from the right. Large liquidations are visualized as airstrikes, adding a visceral element to the scene. The entire setup runs client-side, leveraging Canvas 2D graphics, WebAudio synthesis, and stream processing, with a minimal footprint of roughly 180KB.
Features include an automatic camera that shifts perspectives between broad views and detailed skirmishes, a live DEFCON meter indicating market volatility, and a scrolling war log narrating ongoing activity. A synthetic soundtrack generated within the browser heightens the tension, and a comprehensive scoreboard tracks seconds won, casualties, and territorial gains in dollars. Importantly, the project states explicitly that it is not a trading tool, wallet, or advice platform, but an artistic data visualization designed to offer a raw, cinematic view of Bitcoin market activity.
Implications of Artistic Market Visualization
This project demonstrates how advanced browser technologies can be harnessed for creative data visualization, providing an immersive, real-time view of market dynamics. It underscores the potential for artistic representations to enhance understanding of volatile markets, especially for tech enthusiasts and visual learners. While not intended for trading or investment decisions, it offers a novel way to interpret market chaos, emphasizing the raw, unpredictable nature of Bitcoin trading.
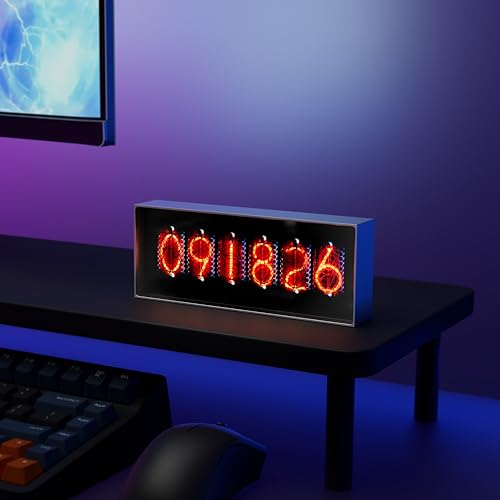
Electronic Display for Real-Time Cryptocurrency/Bitcoin/Stock Market Data, Time, Weather & Temperature, 164*28*65mm, Supports Image Upload and 30s Video Playback, App-Controlled, 960*360 Resolution
Real-Time Data Display – Shows live cryptocurrency (Bitcoin), stock market trends, time, weather, and temperature updates at a…
As an affiliate, we earn on qualifying purchases.
As an affiliate, we earn on qualifying purchases.
Background of Market Data Visualizations and Web Tech
Traditional market data visualization tools focus on charts, graphs, and numerical indicators. The Bitcoin War project pushes beyond conventional methods, employing WebSocket streams, Canvas graphics, and WebAudio to create an interactive battlefield scene. It builds on recent advances in client-side web tech that enable complex, real-time visualizations without backend infrastructure. The project is part of a broader trend exploring artistic and immersive representations of financial data, aiming to engage audiences through visceral, cinematic experiences.
“This visualization transforms raw market data into a visceral, cinematic experience, offering a new perspective on the chaos of trading.”
— an anonymous researcher

Vastarry Crypto Price Ticker Display – WiFi Bitcoin Ethereum Real-Time Dashboard, Desktop LED Monitor for Cryptocurrency Gold Silver Prices, Smart Investment Gift for Traders
Multi-Market Coverage Supports cryptocurrencies, spot gold, spot silver, forex, US stocks, Hong Kong stocks, and A-shares. Cryptocurrency data…
As an affiliate, we earn on qualifying purchases.
As an affiliate, we earn on qualifying purchases.
Unconfirmed Aspects of Market Impact and Future Plans
It is not yet clear whether this visualization will influence trading behavior or market perception. The project explicitly states it is not a trading tool or advice platform, but its potential to impact viewer understanding remains untested. Additionally, details about future updates, broader adoption, or integration with other platforms are still under development.

CryptoTicr Bitcoin Ticker – Real-Time Crypto Price Display (1.54" Diagonal) for Top 1,000 Coins Like Bitcoin, Ethereum, Dogecoin, and 997 more. Compact Size, Ideal for Desk or Nightstand. Uses Wi-Fi.
CryptoTicr is a passion project of a dedicated USA-based creator focused on crafting the finest cryptocurrency ticker available….
As an affiliate, we earn on qualifying purchases.
As an affiliate, we earn on qualifying purchases.
Next Steps and Potential Developments for the Visualization
The developers plan to continue refining the visualization, possibly adding features like user interaction, expanded data sources, or more detailed battlefield scenarios. They may also explore ways to engage broader audiences beyond tech enthusiasts. Monitoring user feedback and technical updates will be key to understanding how this project evolves and whether it influences perceptions of market volatility.

The 2023 Report on Interactive Displays: World Market Segmentation by City
As an affiliate, we earn on qualifying purchases.
As an affiliate, we earn on qualifying purchases.
Key Questions
Is this visualization meant for trading decisions?
No, the project explicitly states it is not a trading tool or advice platform. It is an artistic, data-driven visualization designed for visual and experiential engagement only.
How does the visualization work technically?
It connects directly to the Binance trade stream via WebSocket, rendering each trade as a combatant using Canvas 2D graphics and WebAudio synthesis, all running client-side in the browser.
Can I customize or interact with the battlefield?
Currently, the visualization is automated with camera shifts and pre-set features. Future updates may include more user interaction, but at present, it functions as a passive, cinematic display.
Is this visualization accurate or representative of actual market conditions?
It provides a real-time visual representation of market activity based on live trade data, but it is intended as an artistic interpretation rather than a precise analytical tool.
Where can I see the visualization?
Visit war.isbitcoindead.com to experience the live battlefield visualization of Bitcoin trading activity.
Source: ThorstenMeyerAI.com