
📊 Full opportunity report: The Bubble Question, Disentangled: 1999 vs 2026 Category by Category on ThorstenMeyerAI.com — validation score, market gap, and execution plan.
TL;DR
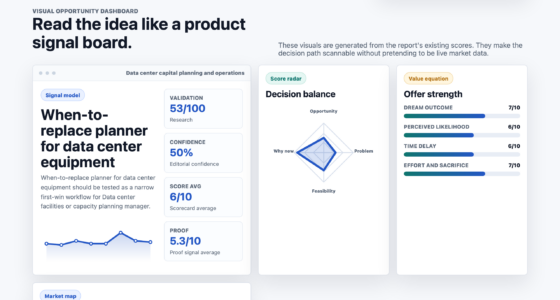
This analysis compares the current AI investment environment with the 1999 dotcom bubble, identifying which aspects are bubble-like and which reflect genuine value. The cycle is structurally bifurcated, with some categories showing bubble signals and others indicating real progress.
Recent statements and data indicate that the AI investment cycle in 2026 exhibits both bubble-like signals and signs of genuine value, mirroring and diverging from the 1999 dotcom bubble in specific categories.
Key indicators such as private valuations, capital expenditure, and concentration of investments suggest bubble characteristics in certain sectors like AI startups and hyperscaler infrastructure. For example, private valuations for AI companies like OpenAI and Anthropic have reached hundreds of billions of dollars, far exceeding 1999 peaks. Capital commitments to AI infrastructure, estimated at $725 billion in 2026 alone, are comparable to the scale of telecom infrastructure buildout during the dotcom era but are driven by different fundamentals.
Conversely, some metrics point to a more grounded cycle: earnings growth from the Magnificent Seven, real productivity gains, and actual revenue at scale support the view that parts of the AI sector are delivering durable value. The divergence in signals has fueled debate among analysts, with some emphasizing bubble signals based on capital allocation and valuations, and others highlighting tangible technological progress and economic impact.
Not binary.
Category by category.
Some bets show clear bubble dynamics. Some show durable value. The disentanglement matters more than the aggregate framing.
OpenAI $730B private valuation. Anthropic $380B. Mag 7 forward P/E 38× vs Dot-com peak 30×. BUT: earnings-driven returns (78%) vs Dot-com multiple-driven (314%). Real productivity gains. Mag 7 outsized free cash flow. Carlota Perez framing applies.
Two cycles. Twelve dimensions.
On price-and-fundamentals dimensions, 2024-2026 is more grounded than 1999. On capital-allocation dimensions, 2024-2026 has bubble-comparable or worse characteristics. The dual signal explains the analyst disagreement.

From Data to Dollars: Getting Started with Data Analytics and AI in Startups
As an affiliate, we earn on qualifying purchases.
As an affiliate, we earn on qualifying purchases.
Five frothy. Five durable. Three contested.
The honest read: the cycle is structurally bifurcated. Some categories are not in bubble territory; others are. The contested middle is where the bubble question actually resolves through 2027-2028.
- Mega-deal concentrationOpenAI $730B, Anthropic $380B, Databricks $134B.
- Circular financingMSFT→OpenAI→CoreWeave→NVDA→MSFT loop.
- Capex velocity$725B exceeds revenue translation. $1.5T debt by 2028.
- Cahn / Sequoia argument$5T buildout requires AGI by 2030.
- Capital-flow speed$700B retail equity since Jan · 5× faster than 2000.
- Hyperscaler capex justificationCahn (only AGI) vs Goldman (justified by trajectory).
- NVIDIA addressable shareCUDA moat vs in-house silicon migration to 30-45% by 2028.
- Frontier-lab valuationsPlatform companies vs commodity API providers.
- Earnings-driven returns78% earnings · 9% multiples vs Dot-com 314% multiples.
- Mag 7 FCF + buybacksMicrosoft $90B FCF · Alphabet $70B · structural cushion.
- Profit weight matchesTech ~30% market cap, ~20% profits vs 1999 35%/10% gap.
- Forward margins recordS&P Tech margin estimates at all-time highs.
- Real productivity30-50% call center · 20-40% software eng · measurable today.

The AI Hardware Gold Rush: How to Invest in the Infrastructure Behind the AI Boom: NVIDIA, AMD, TSMC, ASML, Data Centres and Power Stocks — The Complete Investor's Guide for 2026-2027
As an affiliate, we earn on qualifying purchases.
As an affiliate, we earn on qualifying purchases.
Three paths. One question.
35/50/15 probability. Base scenario most likely because durable-value supports prevent worst-case but bubble signals are too strong to resolve without correction.
- Frothy correct 30-50%Frontier labs, circular financing.
- Mag 7 sustainsReal productivity continues.
- Hyperscaler capex defensibleMixed but justified.
- NVIDIA gradual decelNot sharp.
- Outcome: Uneven returns. Big winners + losers. No broad crash.
- Frontier labs -40-60%From 2026 peaks.
- Hyperscaler impair$50-150B capex aggregate.
- NVIDIA sharp decelFY28 30-50% growth vs FY26 75%.
- NASDAQ -30-50%12-24 month period.
- Outcome: Mag 7 cushion holds. Deployment continues delayed.
- NASDAQ -60-78%Matching 2001-2003 magnitude.
- Frontier labs collapseBelow VC entry pricing.
- Hyperscaler impair $300-500BMajor capex writedowns.
- NVIDIA negative quartersRevenue compression.
- Outcome: Multi-year recovery. Deployment 2032-2033.
The 2024-2026 cycle is structurally more grounded than 1999 on price-and-fundamentals dimensions and structurally similar or worse on capital-allocation dimensions. The bifurcation explains the analyst disagreement and predicts the correction pattern: specific categories correct sharply while others persist.
The AI-Powered Professional: AI Productivity for Business Professionals Without the Technical Overwhelm (The AI-Powered Professional Series Book 1)
As an affiliate, we earn on qualifying purchases.
As an affiliate, we earn on qualifying purchases.
Four assignments. By role.
Stop pricing AI as single asset class.
Differentiate Mag 7 (durable-value-leaning) from pure-play AI infrastructure (bubble-leaning) from contested middle (NVIDIA, frontier labs). Position long durable-value categories; short or underweight bubble-categories with circular-financing exposure. Use Perez framing to size correction expectations.
Pace through 2026-2027.
Preserve dry powder for 2028-2029. Mega-rounds at $300B+ valuations carry asymmetric correction risk. Mid-stage product-market-fit names with real revenue carry durable value through any plausible correction. The 1999 lesson: winners eventually recover; losers don’t.
Build for survivable correction.
18-24 month cash runway assumptions that survive 30-50% valuation correction. Prioritize real revenue over narrative-driven funding. Structure cap tables to absorb down-round scenarios. Peak-fundraising window of 2025-2026 may not persist; raise opportunistically while it does.
Multi-vendor sourcing for price volatility.
Plan for AI service price volatility through 2027-2028. Prices may rise (power constraint) or fall (frontier-lab competitive pressure). Multi-vendor sourcing reduces single-vendor exposure. Contractual flexibility (escalators, exit provisions, renegotiation triggers) preserves optionality.

NO|BS Foodservice + Hospitality Reports: Canadian Industry Trends, January 2026
As an affiliate, we earn on qualifying purchases.
As an affiliate, we earn on qualifying purchases.
Implications of the Category-by-Category Bubble Analysis
This nuanced understanding matters because it influences investment strategies, policymaking, and corporate decision-making. Recognizing which AI sectors are bubble-prone can help prevent financial losses, while identifying sectors with genuine value can guide resource allocation toward sustainable growth. The analysis suggests that some investments may correct sharply if bubble signals dominate, whereas others could persist and compound through deployment cycles, shaping the AI landscape through 2027-2030.
Historical and Current Data Comparing 1999 and 2026 AI Cycles
The 1999 dotcom bubble was characterized by excessive venture capital deployment ($54 billion), high valuations disconnected from fundamentals, and extreme concentration in unprofitable companies. When the bubble burst, companies like Pets.com and Webvan collapsed, but durable firms like Amazon and Cisco survived and thrived. Today, the AI cycle shows similar signs—extreme private valuations, concentrated VC funding (73% of AI VC investments), and large-scale infrastructure commitments—yet it also differs through more tangible earnings growth and real revenue at scale.
This comparison reveals that while some bubble features are present, the current cycle’s fundamentals are more grounded, with real productivity gains and revenue growth supporting the valuation levels.
“The cycle is structurally bifurcated, with some categories showing bubble signals and others indicating real progress.”
— Thorsten Meyer
Uncertainties in the AI Bubble Disentanglement
It remains unclear how many high-valuation AI startups will sustain their valuations amid potential corrections. The pace and scale of earnings growth, the durability of productivity gains, and the actual deployment of AI infrastructure beyond hype are still developing. Additionally, the timing and magnitude of potential corrections in bubble-prone categories are uncertain, making precise predictions difficult.
Future Developments to Watch in AI Investment Cycles
Monitoring the evolution of private valuations, infrastructure investments, and earnings growth through 2026-2027 will be critical. Key indicators include the performance of major AI companies, shifts in venture funding concentration, and the pace of real-world productivity gains. Policymakers and investors should focus on categories with tangible fundamentals while remaining cautious of sectors exhibiting bubble signals, as the cycle will likely resolve differently across segments.
Key Questions
Are we currently in an AI bubble?
The analysis indicates that some categories, such as private valuations and infrastructure investments, show bubble-like signals, while others, like earnings growth and real revenue, suggest a more grounded cycle. Overall, the cycle is bifurcated.
Which AI sectors are most at risk of a correction?
High-valuation startups with extreme private valuations and concentrated VC funding are most vulnerable if bubble signals dominate. Infrastructure investments driven by hype may also face corrections.
What evidence supports the view that parts of AI are delivering real value?
Observable productivity gains, actual revenue at scale, and earnings growth from leading companies support the argument that certain AI applications are producing durable and tangible economic benefits.
How does the 2026 cycle compare to the 1999 dotcom bubble?
While similarities exist in valuation excess and concentration, the current cycle shows more grounded fundamentals, with real earnings growth and productivity gains, unlike the speculative nature of 1999.
What should investors focus on moving forward?
Investors should differentiate between bubble-prone categories and those with sustainable fundamentals, monitoring key indicators like earnings, revenue, infrastructure deployment, and valuation trends over the coming years.
Source: ThorstenMeyerAI.com